
Quick GitHub profile visit counter
July 13, 2020
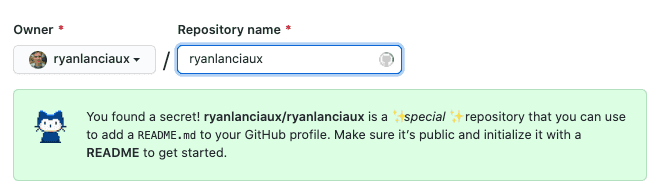
GitHub profiles are a great addition to the platform. These profiles allow you to highlight your experience/interests and supply a little bit of personality to what people see when they visit your profile. There are quite a few guides on creating a profile, but for those who may not have jumped into that just yet, you can add your profile by creating a new repository that matches your GitHub username. Any edits to the index.md file will show up when people vist github.com/{yourusername}
Website Counter
I wanted to see if I could make my profile look a little bit like a website from the 1990s. A big part of any 90s personal website is the visitor counter. We can create a fun (and not necessarily accurate) counter pretty quickly using node and express. I ended up using Glitch for mine, but this concept should work on any platform that supports node.

Take a look at my GitHub profile to see this in action.
Node / Express project
The entire code for this project is posted below (or in this GitHub gist, or where it’s running on Glitch). There are a lot of practices that we’d either want to avoid or clean up if it was for more of a production application. The key here is something that could be accomplished quickly for fun.
Tracking visits
From a high level, this application has a variable that records visit counts, an endpoint that responds to count.svg and updates the visit counts. Additionally, the count.svg endpoint should generate and respond with an image based on the count.
const express = require('express')
const app = express()

const PLACES = 7;

// no db - so global var to keep track of count
let counter = 0

function getCountImage(count) {
   ...
}

// get the image
app.get('/count.svg', (req, res) => {
  counter++;

  // This helps with GitHub's image cache
  //   see more: https://rushter.com/counter.svg
  res.set({
  'content-type': 'image/svg+xml',
  'cache-control': 'max-age=0, no-cache, no-store, must-revalidate'
  })

  // Send the generated SVG as the result
  res.send(getCountImage(counter));
})

const listener = app.listen(process.env.PORT, () => {
  console.log('Your app is listening on port ' + listener.address().port)
})
Tracking visit count
We’re using the global counter variable to keep track of visits. When a request comes in to count.svg, we update the global counter variable and generate an image.
// set up the counter variable
let counter = 0;

...
app.get('/count.svg', (req, res) => {
  // update the counter on any image request
  counter++;
  ...
}
Generating an image
I created an image in Sketch and copied the results as SVG and pasted it into the getCountImage method. The image was dissected a bit and rebuilt using our count value.
You’ll notice in this function, we’re switching the count to a padded string, and then into an array. This allows us to show the zeros before the count with the specified number of PLACES. const countArray = count.toString().padStart(PLACES, '0').split(''); From there, we build the count squares part of the image by reducing the array into a single string, and then referencing that in the svg.
Reduce can be a bit tricky to follow at times, and could often be replaced by a more standard loop construct. In this case, we’re saying, iterate through all the array elements and append this new svg section with what came before.
function getCountImage(count) {
  // This is not the greatest way for generating an SVG but it'll do for now
  const countArray = count.toString().padStart(PLACES, '0').split('');

  const parts = countArray.reduce((acc, next, index) => `
        ${acc}
        <rect id="Rectangle" fill="#000000" x="${index * 32}" y="0.5" width="29" height="29"></rect>
        <text id="0" font-family="Courier" font-size="24" font-weight="normal" fill="#00FF13">
            <tspan x="${index * 32 + 7}" y="22">${next}</tspan>
        </text>
`, '');

  return `<?xml version="1.0" encoding="UTF-8"?>
<svg width="${PLACES * 32}px" height="30px" version="1.1" xmlns="http://www.w3.org/2000/svg" xmlns:xlink="http://www.w3.org/1999/xlink">
    <title>Count</title>
    <g id="Page-1" stroke="none" stroke-width="1" fill="none" fill-rule="evenodd">
      ${parts}
    </g>
</svg>
}
Wrapping up
Ideally, we would want to persist our count to ensure that if the server restarts, the count values picks back up where we left off. This could be something like a database record, or simply writing to a file. For this example, I don’t care too much if I lose the count as it’s mostly to achieve the 90s design aesthetics :D
The full code is available in this GitHub gist, or where it’s running on Glitch.
Additional references:
I started off referencing an analytics example by Flavio Copes available here. In this example, Flavio created an svg that would collect website visit counts as a simple alternative to Google Analytics.
This article on the same topic by Artem Golubin was really helpful in determining how to adjust the HTTP headers to work with GitHub’s image caching. GitHub has an excellent feature that anonymizes browser details from images to help prevent tracking called Camo. Without adjusting the HTTP headers, the image would not update upon new visits.

Hi 👋 I'm Ryan Lanciaux. I run Spaceship Studio, LLC. a consultancy specializing in fast and dynamic web and native mobile applications.
I live in Ann Arbor with my wonderful family! In my freetime, I create electronic music.